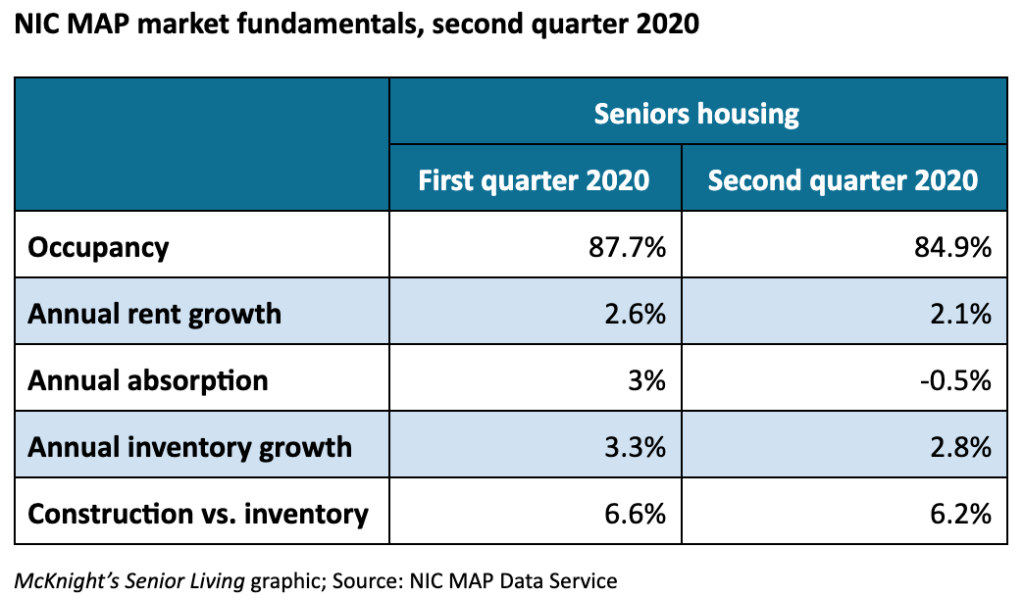
Senior housing occupancy in the second quarter was at the lowest level on record since the National Investment Center for Seniors Housing & Care began reporting data in 2006, NIC said Thursday.
Combined occupancy for independent living and assisted living communities fell 2.8 percentage points, from 87.7% to 84.9%, the largest quarterly decline in the 14-year period, according to new data from NIC MAP Data Service.
“It’s a challenging time for operators of senior housing properties,” NIC Chief Economist Beth Burnham Mace told McKnight’s Senior Living. “There are a lot of unknowns, and no one’s crystal ball is tuned enough to be able to tell us when we’ll be through the COVID pandemic-related challenges.”
Assisted living is pulling down the average, Mace said.
“That’s been the case for a while, even pre-COVID,” she said. “That had to do with the fact there was a lot more construction that had happened in assisted living more so than independent living. And a lot of construction in assisted living was more than the market could readily absorb.”
During the pandemic, Mace said, COVID-19 is disproportionately affecting the older, frailer residents who live in assisted living communities. “It’s understandable why assisted living occupancy dropped at a greater rate than independent living in the second quarter,” she said.
Individually, the sectors of assisted living and independent living set or matched previous record lows for occupancy in the second quarter, Mace said.
Assisted living occupancy decreased 3.2 percentage points to 82.1% during the quarter, the lowest point on record, she said, adding that the prior low point, 85%, was reached in 2019. The occupancy rate for independent living decreased 2.4 percentage points to 87.4% in the second quarter, which tied a low set in the first quarter of 2011.
Occupancy declines lessening — for now
Declines in occupancy are lessening, however, according to NIC MAP intra-quarterly data.
In the quarter, the largest senior housing occupancy decline occurred in April, during the first full month of the COVID-19 pandemic in the United States. That month, occupancy fell 1.5 percentage points to 86.2%. The decline lessened in May, when occupancy fell 0.8 percentage point to 85.4%, and pulled back further in June, when the drop was 0.5 percentage point to 84.9%.
“That said, the June data doesn’t reflect yet the rising cases and the resurgence of COVID that we’re seeing in parts of the West and the South,” Mace said. “I don’t know what the impact of the resurgence in the general population will be on seniors housing in the West and the South, but we do know that the cases are rising. So I don’t know if that monthly decline will continue.”
One factor that may come into play, she said, is that operators are in a better position than they were in February and March in terms of having protocols for safety, admissions and visitations.
“We have much more knowledge and understanding of this virus — not everything we need to know, but more than we did,” Mace said. “Businesses are prepared better than they were with [personal protective equipment] and testing, although both PPE and testing still remain challenges.”
The ability to test residents and employees regularly and obtain test results quickly will be key, and those abilities vary across the country, she said. “We’re hardly out of the woods, but at least our eyes are wider open in terms of understanding than what they had been.”

Absorption rates telling
Absorption — the change in the occupied units from the previous quarter — was at a record level, too, Mace said, but a demand for senior housing still exists.
“If you look at the actual rate of absorption, that was a –0.5%. That’s never happened, that level,” she said. “But if you look at the actual number of units that are occupied, while the decline in the number of units occupied was large, it just brought us back to the level of the first quarter of 2019.”
Said another way, Mace said: “In one quarter, we lost five quarters’ worth of gain in occupied units. That’s not good, obviously, but it’s not like the sky is totally falling. There are still a lot of people who are residing in senior housing units.”
‘A tale of many properties’
Distributions of occupancy reveal good news for some operators and challenges for others, Mace said.
In the second quarter of 2020, the average occupancy rate was 84.9%, but the median occupancy rate was 88.2%, she said. More than 40% of properties in the second quarter had occupancy rates higher than 90%, and 20% had occupancies higher than 95%. On the flip side, 28% of properties had occupancies below 80%, and 12% were less than 85%.
“So it’s kind of a bifurcation that you’re seeing in properties. If you happen to be in the 28% of those properties with less than 80% occupancy, you’re going to be significantly more challenged in the COVID-19 environment than you would be if you’re in that 20% that had occupancy rates higher than 95%,” Mace said. “Everybody’s going to get squeezed, but it’s going to be more difficult to withstand if you’re one of those properties that went into it fairly weak, with low occupancy rates, and continue to have low occupancy rates. So it’s a tale of many properties, and they don’t all behave the same.”
Occupancy rates vary by city, too
The only two markets where occupancy gains occurred between May and June were Sacramento and Cleveland, increasing to 85.4% and 84.5%, respectively.
“If I look at a slightly longer period, that story is not quite so rosy,” however, Mace said, advising not to “overinterpret” the data.
In Sacramento, for instance, occupancy went from 89.2% in March to 85.5% in April to 85.2% in May and 85.4% in June. And in Cleveland, occupancy went from 85.4% in March to 84.5% in April to 83.8% in May to 84.5% in June.
Atlanta and Denver saw the largest occupancy losses during the same time period. In Atlanta, Mace said, the occupancy rate was 78.9%. “Pre-COVID, Atlanta was poorly off in terms of occupancy because there had been a lot of construction that had outpaced demand,” she said.
San Jose (92.3%), San Francisco (89.5%), Baltimore (89.0%) and Tampa (87.5%) had the highest second quarter occupancy rates of the 31 metropolitan markets that comprise NIC MAP’s primary markets, whereas Houston (78.5%), Atlanta (78.9%) and Las Vegas (81.4%) recorded the lowest.
Construction starts down, but projects continuing
NIC MAP’s 31 primary markets saw 15,471 new construction starts in the past four quarters, the fewest new starts since 2014.
“There’s a delay sometimes in the reporting of some of these data, so it might get revised up to some degree,” Mace said. “But there definitely is a pattern of it slowing down.”
Anecdotally, Mace said she has heard from banks and developers that projects that had broken ground still are proceeding, but perhaps more slowly.
“It takes a year and a half to two years to go from groundbreak to opening, at least initially,” she said. So some are predicting that by 2022, the industry could be back to whatever the new normal is.


