Assisted living supply has improved in three states in recent years, as measured by the number of assisted living and residential care units per 1,000 people aged 75 or more years, according to the 2020 Long-Term Services and Supports State Scorecard, released Thursday by the AARP and the AARP Foundation, the Commonwealth Fund and the SCAN Foundation.
In Arkansas, units per 1,000 increased from 29 in 2014 to 35 in 2016; in Kansas, units per 1,000 went from 64 in 2014 to 87 in 2016; and in Nevada, units per 1,000 rose from 28 in 2014 to 38 in 2016, the report authors said.
Units per 1,000 declined in one state, Oregon, which saw a decrease from 121 in 2014 to 95 in 2016 but still remained in the top quartile on the 2020 scorecard, according to the report. Forty-three states saw no significant change in the number of assisted living units per 1,000, and data were missing for at least one of the two years measured for four states (Connecticut, Hawaii, Iowa and Wyoming).
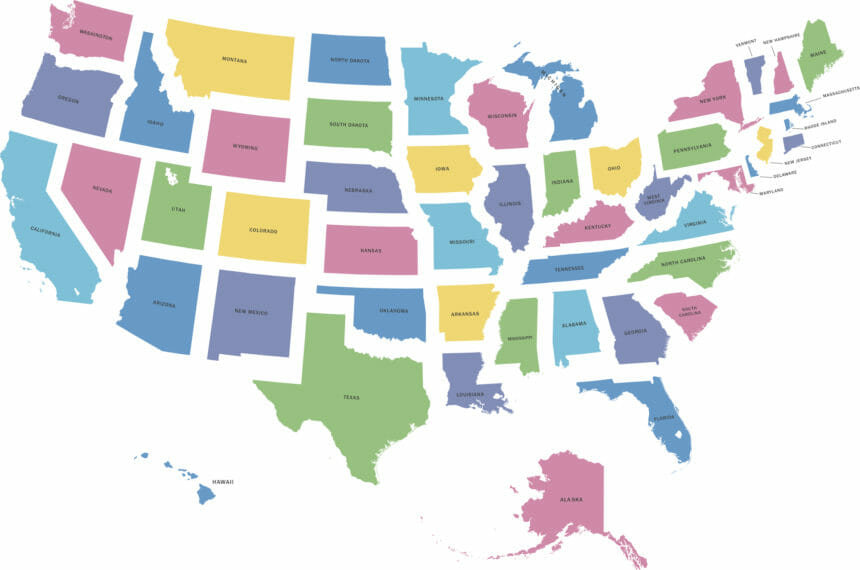
Overall, the report authors said, the supply of assisted living and residential care units, according to data from the most recent year included, varies “drastically,” ranging from a high of 102 units per 1,000 in North Dakota to a low of 20 units per 1,000 in Louisiana. “The bottom five states averaged just 24 units per 1,000 people ages 75 and older, whereas the top five states averaged 93 units, a fourfold difference,” they noted.
In addition to North Dakota and Oregon, other states in the top quartile in assisted living supply on the 2020 scorecard: Minnesota (90 units per 1,000), Alaska (89), Kansas (87), Washington (85), Wisconsin (84), Idaho (82), Montana (80), Nebraska (73), South Dakota (72) and Vermont (62).
States in the bottom quartile on the 2020 scorecard, in addition to Louisiana, included Arkansas and New Jersey (each 35 units per 1,000), Massachusetts and New Mexico (34 each), Mississippi and Texas (33 each), Delaware (30), New York (27), Alabama and Hawaii (26 each) and West Virginia (24). Washington, D.C., also was in the bottom quartile (23).
The 64-page report, according to its authors, aims to empower the private sector, state and federal policymakers and consumers with information they need to assess their state’s LTSS performance across multiple dimensions and indicators, learn from other states and improve the lives of older adults, people with disabilities and their families.
“With only incremental improvement across indicators at a time when demographic trends portend a rapid increase in LTSS demand, the Scorecard results suggest that many states may not be well prepared to offer affordable, accessible LTSS choices for individuals in the future,” the authors warned.
Assisted living supply is one of seven indicators helping to assess available choice of setting and provider, defined as “Consumers are at the center of care and have the choice of setting and control over their services and who provides them.”
Choice of setting and provider, in turn, is one of five dimensions measured in the report to assess overall performance of the LTSS system. Other dimensions discussed include affordability and access, quality of life and quality of care, support for family caregivers, and effective transitions.
Data for the report were collected from 2016 to 2019. Information on each state is available at the interactive map and other tools on this web page.


