
A new report from the Centers for Disease Control and Prevention’s National Center for Health Statistics sheds light on the characteristics of the 28,900 assisted living and similar residential care communities that were providing long-term care services as of 2016.
The report, titled “Long-Term Care Providers and Services Users in the United States: 2015-2016” (PDF), is “intended to inform policy makers, providers, researchers, consumer advocates, the media, foundations, and others to inform planning for long-term care services,” according to the authors.
Highlights:
Location. The supply of residential care beds per 1,000 people aged 65 or more years was higher in the Midwest and West than it was in the Northeast and the South. Specifically, 40.8% of the communities were located in the West, 28% in the South, 22.6% in the Midwest and 8.6% in the Northeast. Metropolitan areas were the settings for 82.5% of communities.
Business model. 81% of communities were for-profit, 17.7% were nonprofit and 1.3% had government or other ownership. Chain affiliation applied to 57.2% of communities.
Medicaid certified. 48.3% of residential care communities were Medicaid-certified.
Size. One to 25 people were served daily in 65% of the communities, 30.7% served 26 to 100 daily and 4.3% served 101 or more people daily.
Staff. In 2016, one-fifth of the all long-term care nursing and social work employees (1.46 million nursing employee full-time equivalents — including registered nurses, licensed practical nurses or licensed vocational nurses, and aides — and about 35,000 social work employee FTEs) were employed by assisted living or residential care communities.
The most common employee type in assisted living/residential care was aide. Of the 298,800 FTEs in assisted living and similar residential care communities, 83.3% were aides, 9.9% were LPNs or LVNs, 6.1% were RNs and 0.8% were social workers.
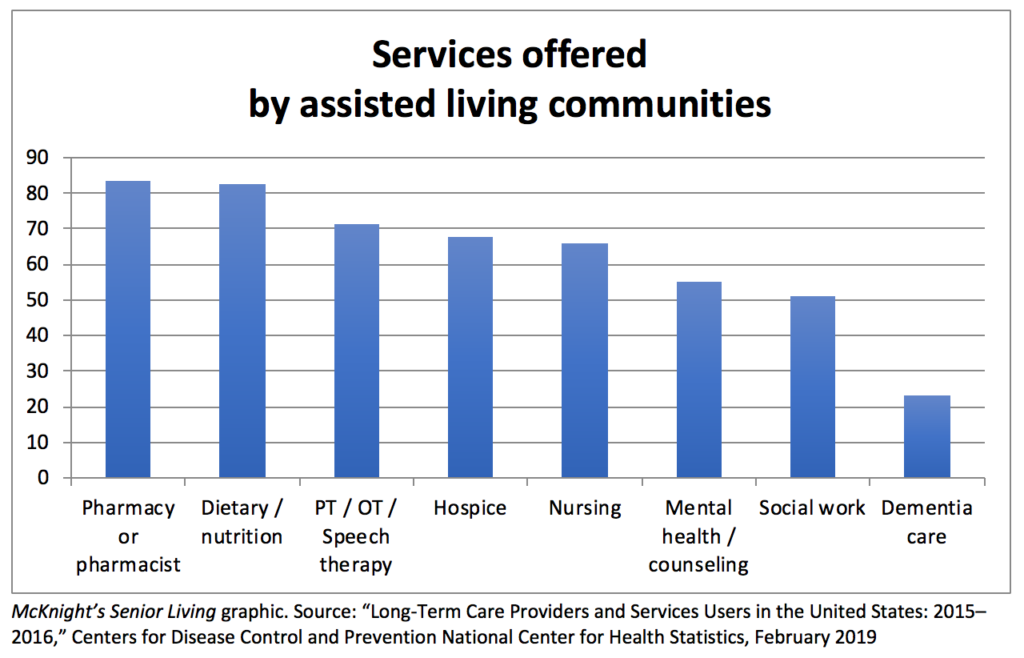
Services offered. Pharmacy services / pharmacist was the most commonly offered service among those measured, with 83.6% of communities offering it. Other services: dietary / nutrition services (82.8%); physical, occupational or speech therapy (71.4%); hospice (67.7%); nursing (66.1%); mental health or counseling (55%), and social work (51.1%).
Alzheimer’s and dementia care. 77% of assisted living/residential care communities did not have dementia care units; 14.3% had a unit, wing or floor designated as a dementia care unit; and 8.7% served only adults who had dementia. More than 40% (41.9%) of residents had received a diagnosis of Alzheimer’s disease or dementia.
The report details the current national picture of providers and users of services in five major sectors. In addition to assisted living, the sectors include adult day service centers, home health agencies, hospice and nursing homes. This the third descriptive overview report that the NCHS has issued monitoring national and state trends. The previous report was issued three years ago.