
Senior housing occupancy (independent living and assisted living combined) held steady at 78.7% in the second quarter compared with the first quarter, despite declining cases of COVID-19 and increasing interest in independent living and assisted living, according to NIC MAP data released Thursday afternoon.
The culprit largely is the amount of new inventory becoming available, according to the National Investment Center for Seniors Housing & Care.
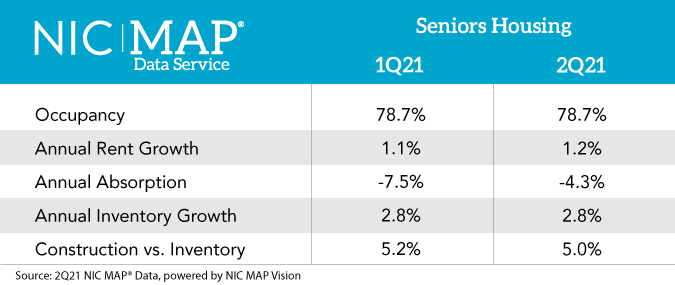
“Second-quarter data confirms anecdotes that occupancy at many properties improved as move-ins accelerated, thanks to limited property-level COVID-19 infections,” NIC Chief Economist Beth Burnham Mace said in a statement. “However, inventory grew and outpaced demand, and that’s why we aren’t seeing an occupancy uptick.”
Demand improved in the second quarter, as evidenced by the first positive quarterly absorption — the number of units leased on a net basis — since the first quarter of 2020 and the most positive absorption since 2019, according to the data.
Overall, however, both assisted living and independent living properties experienced little change in occupancy, with independent living holding steady at 81.8% and assisted living inching up to 75.5%.
Variation by market
A growing number of operators are reporting occupancy increases, however, as a closer look at the data reveals, NIC said. In the second quarter, 47% of senior housing properties in the NIC MAP primary markets reported an increase in occupancy. During the height of the pandemic, that number was 22.5%, according to NIC MAP.
But results vary by market.
“Some areas of the country are seeing senior housing occupancy improve, but the data show that we haven’t fully turned the corner,” NIC Chief Operating Officer Chuck Harry said. “Senior housing occupancy remaining unchanged suggests that it will likely take more time to see broad, nationwide improvement to the levels prior to the onset of the pandemic.”
A wide gap in performance exists between markets in NIC MAP’s primary markets. In Atlanta and Detroit, for instance, 55% of properties reported an improvement in overall occupancy. In Chicago, however, only 33% of properties reported occupancy improvement.
San Jose, CA (83.7%), Portland, OR (83.4%) and San Francisco (83.4%) had the highest second-quarter occupancy rates of the 31 metropolitan markets that encompass NIC MAP’s primary markets, data show. The markets seeing the lowest occupancy rates in the second quarter included Houston (73%), Atlanta (74.8%) and Las Vegas (74.9%).